Buying a rental property isn’t only about how much money you earn, but also how much debt you have. If you plan to get a loan to finance your investments, maintaining a healthy debt-to-income ratio is essential. For investors, particularly those with several properties in their portfolio, carrying a lot of debt can be an issue, which is why offsetting it with high income is paramount.
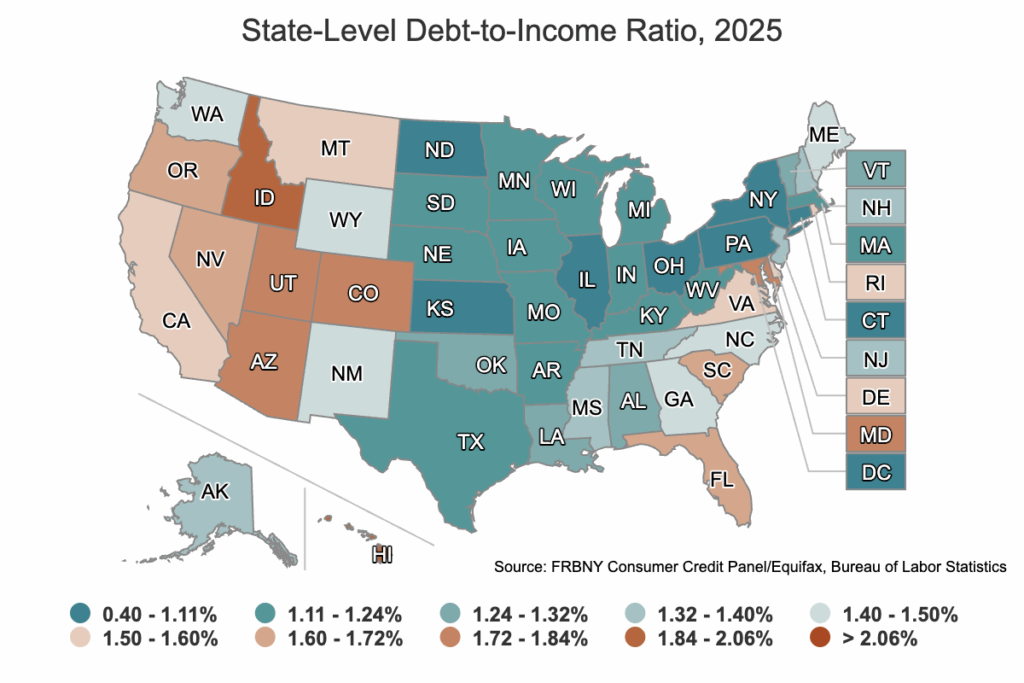
The Federal Reserve has just released its national debt-to-income map, which shows where the best-qualified buyers actually live. For fix-and-flippers and landlords looking to buy and hold, it provides an invaluable snapshot of what lenders look for in borrowers and the regional shifts at play.
The map shows that most qualified buyers are not necessarily where you think they are.
What Is DTI?
A debt-to-income ratio, as the name suggests, measures a person’s debt when measured against their income. The highest DTI averages—over 2.0—mean residents carry $2 in debt for every $1 of income.
When it comes to DTIs, less is more. The more income, the less debt wins. For example, if half your monthly income went toward paying off your recurring monthly debt, your DTI would be 50%, which is not good. A DTI of 35% or less is considered favorable by lenders.
Shifting Debt-to-Income Ratios: The 2025 Landscape
Historically, the wealthier states on both coasts have been renowned for both high housing prices and equally high buyer and rental demand. That’s because many of these areas are considered “barrier” markets, i.e., there is a barrier to land availability, forcing prices up.
According to the Federal Reserve’s map,…