The goal of higher rates, in my view, is to cool down price growth and get more days on the market. A few key data lines can tell us if we are heading in that direction.
We are still seeing numbers in the teens for days on market, which isn’t good. We would like to get this back to 30 days, but anything in the 20s is a victory. Inventory falling again in 2022 created more forced bidding wars, which frustrates buyers, keeps potential sellers from wanting to list, and creates stress for real estate agents doing a lot of work with nothing to show for it. In addition, the Federal Reserve isn’t comfortable with home prices going up every year.
This is a first-world problem compared to a housing bubble, a credit boom, and a crash, but a problem nonetheless. Some data to consider:
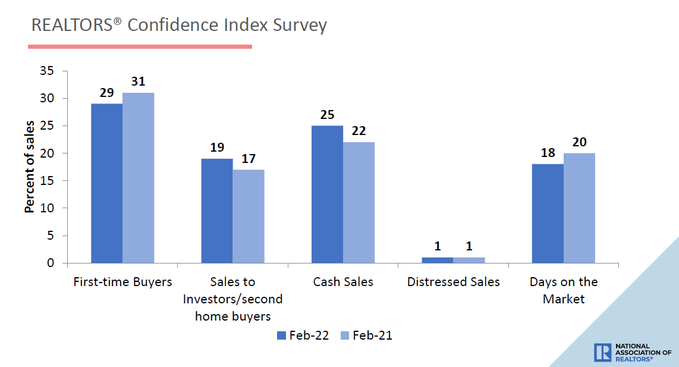
1. In NAR‘s most recent existing-home sales report, as you can see below, the days on market is still at a teenager level. We need our housing market to go to college and find a room to rent in their 20s.

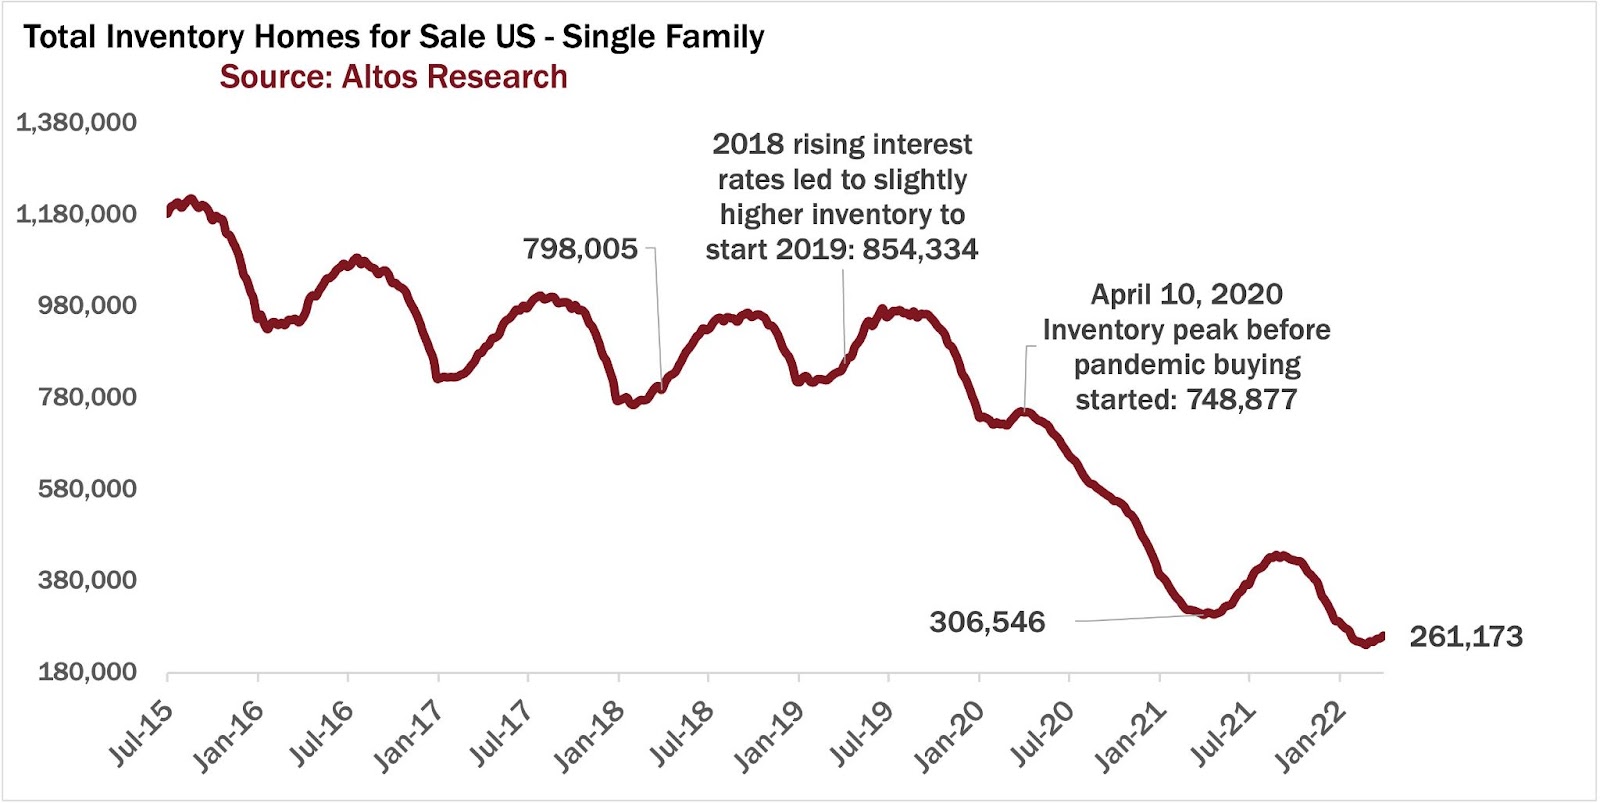
2. Inventory is still showing negative year-over-year data. Even this week, on tax day, it is still showing a decline. However, the year-over-year declines are getting less. We went from a 30% year-over-year decline at the end of 2021 to just a negative year-over-year decrease of 14.8%. I find this to be a very positive trend because the No. 1 goal for me is to see inventory have some positive prints, and we are at least heading in the right direction
From Altos Research:

Are higher rates working now?
So how can we tell if higher rates are doing their job and we can achieve the goals above? Purchase application data has always been an excellent way to understand how the markets work. It’s also a bit of a funky data line if you don’t have experience reading it.
Historically, this data line is instrumental in tracking the year-over-year data from the second week of January to the first week of May. Typically after May, volumes fall! COVID-19 has wrecked the comps for many…